Introduction
Letter to Participants
Thank you for participating in this cancer mapping project. Your involvement and your stories have moved me to finish this report despite my lack of education in epidemiology, statistics, public health, geographic information systems, or any field considered necessary to try to connect the dots between environmental exposures and cancer.
You, as citizens of the White Lake Area, have a history of speaking out to try to keep people safe from toxic exposures. Your efforts were evident in the 1960s through 1980s when you became citizen scientists, investigating the industrial contamination of your air, your drinking water, and your lake. You organized – to express your anger at the affront to your community’s health and to get the pollution cleaned up.
In 1987, after three decades of industrial pollution, White Lake was designated as one of 26 Great Lakes Areas of Concern within the United States. You formed the White Lake Public Advisory Council in 1992 to oversee the cleanup of the lake. Then you spent the next 22 years collaborating as citizen scientists, in an alliance with state and federal government agencies, until White Lake was cleaned up and was delisted as an Area of Concern in 2014.
In 2009, another example of your commitment to science emerged. You became concerned about the number of people in our community being diagnosed with cancer. The Agency for Toxic Substances and Disease Registry (ATSDR) had just released its final report on their study, previously titled, “Public Health Implications of Hazardous Substances in the Twenty-Six Great Lakes Areas of Concern.” However, as explained in the Executive Summary of their 2008 Final Report, the ATSDR concluded that current data did not allow them to “draw firm conclusions about the threat to human health from critical pollutants across the Great Lakes region.” The title of the Final Report was changed to “ATSDR Studies in Chemical Releases in the Great Lakes Region.”
A small group of citizens decided that, if the ATSDR did not have the data, we would have to collect our own data – you responded by choosing to take the time to participate in the White Lake Area Cancer Mapping Project.
Today in the White Lake area, we have clean air to breathe, clean water to drink and a beautiful lake to enjoy. The memories of foul air and tainted water that our community experienced 50 years ago have mostly receded into the distant past. However, throughout the U.S. and the world, millions of people currently live in close proximity to a source of pollution.
While presenting at the 1978 National Conference on the Environment and Health Care, Dr. Marvin A. Schneiderman (pp.33—46) showed maps and tables suggesting possible links between industrial exposure and cancer, and then stated:
It would be nonsense for me to assert that all this increase [in cancer incidence in the U.S.] was due to industrial exposure. It would be equivalent nonsense and possibly criminal to assert that none of it was. [1978, p. 42.]
As I have listened to your stories about your experiences with the industrial pollution of our community’s past, I have come to feel certain that, although not all of the cancers that you reported were caused by industrial exposures, some of them were.
The stories that you shared have moved me to finish what we started in 2009. Your stories about your exposures speak more clearly than any words I could say.
In gratitude to you for your participation,
Claire Schlaff
What We Did, and a Preview of Lessons Learned
In 2009, a small group of concerned citizens organized a Health Committee and began making a list of people with cancer. As our list grew, we launched the White Lake Area Cancer Mapping Project and began the work of determining our criteria for inclusion, developing our survey, and reaching out to the community to invite their participation in the project.
Between 2009 and 2013, 1,051 residents of the White Lake area in Western Michigan shared information about their 1,115 cancers in hopes of helping authorities try to connect the dots between a period of industrial pollution in their town and cancers diagnosed years to decades later. The participants, born 1910 or later, had experienced air and water pollution in the middle of the 20th century, before environmental laws and enforcement procedures were in place.
The Health Committee was astonished at the response. People wanted to participate. They wanted to be counted. They wanted to know what was causing the cancers in their community. They wanted to tell their stories — of the pollution they had experienced, and of their suffering or the suffering of their loved ones with cancer.
We developed our voluntary, self-reporting survey in the fall of 2009. At the outset, we had decided to include all of each participant’s White Lake area addresses on the survey, including the year they moved in and the year they moved out of each residence. We wanted to know whether those who had lived downstream or downwind from a source of pollution were more likely to have eventually been diagnosed with cancer.
We revised our survey twice with guidance from an epidemiologist at Public Health Muskegon County, making our final revision in February 2011. In accordance with our focus on causes and prevention, we added questions about workplaces, family members with cancer, smoking history, and a general question about the survey respondent’s own theories about what may have contributed to the participant’s chance of getting cancer.
Participants each had lived at up to six White Lake area addresses. Now that we had this database of addresses for 1,015 people, along with the locations of the polluting industries of the past century, how would we determine which of the past addresses would be relevant? Given that only a person’s current address at the time of diagnosis is used for official cancer incidence reporting, we had certainly taken on a monumental task.
We couldn’t randomly select the participant’s first address, the last address, or the address at which the participant had lived the most years. Other factors needed to be considered. I plan to discuss those factors in this report. Although I was not able to find a meaningful and instructive way to show all of the participants’ addresses on maps, I plan to share maps that include some groups of participants: for example, the first address of participants who had lived in the White Lake area as children, and maps representing participants’ address at estimated onset of cancer (rather than address at diagnosis) for certain cancer types.
I also will explore barriers and challenges, and I plan to highlight hopeful ideas, avenues of action, and research projects that are occurring or are in the planning stages.
Most of the White Lake area polluters had shut down and the contaminated sites were largely cleaned up before we became aware of the seemingly high numbers of cancers in our town. My heart goes out to people in other communities that are currently enduring unhealthy air and water while facing pollution-related health challenges. At the end of this report, I have listed some options that citizens may now have available to them that may not have been available years ago.
Below is a summary of some conclusions I have come to while looking at these data for the past decade and links to portions of this report where readers may find details on these topics. Each of these links will take you directly to that section of this report, but you can always return here using the navigation links back to the “Introduction” section.
- If we want to know whether living near a polluting industry increases a person’s chance of getting cancer, rather than looking at the data by ZIP code or by census tract (which would include people that lived far away from the pollution source), case-control studies comparing residents living at specified distances away from the source of the pollution have been effective. (See Cancer Incidence Statistics and Proximity to Industry as a Risk Factor.)
- When primary care providers ask about family members with cancer, they should also ask about potential environmental hazards that were shared by those family members while living in the same household. (See Risk Factors.)
- In cancer incidence statistics, cancers are rightly recorded according to residence at diagnosis. In this project we included people who had lived in the White Lake area but had moved away prior to their diagnosis, to try to give us a more complete picture of the cancer burden of this community. (See Cancer Groups and Residence at Diagnosis.)
- Residence Histories and Exposure Histories in Electronic Health Records would provide a data source for researchers. (See Ideas and Hopeful Signs of Progress and My Takeaway.)
- There is evidence that early life exposure to carcinogenic chemicals results in increased risk of cancer later in life. I looked at what percent of the 376 participants that had lived in the White Lake area as children were living in the White Lake area when diagnosed with cancer and what percent had moved away. (See Vulnerability of Children.)
- When we began this project in 2009, we believed that our citizens were being diagnosed at younger-than-expected ages for their cancer types. For 23 adult cancer types for which I was able to find an estimate of the median or average age at diagnosis for the U.S. population, our White Lake area participants reported younger ages at diagnosis for 20 cancer types, and reported the same or older ages at diagnosis for three cancer types. (See Median Age at Diagnosis.)
- We need more research on latency periods between onset and diagnosis of cancer in order to increase the possibility of connecting environmental hazards and cancer. This would allow mapping of addresses at estimated ONSET of cancer. (See Residential Mobility.)
- In tables showing our participants’ workplaces, it is not surprising to see that the work sector with the most participants is the Manufacturing Sector. The subsector with the most participants is Transportation Equipment Manufacturing. (See Workplaces.)
The White Lake Area
The White Lake area, located in the northwest corner of Muskegon County, Michigan, includes two cities and four townships that surround White Lake, which flows into Lake Michigan.
Google Earth Satellite View of the White Lake Area
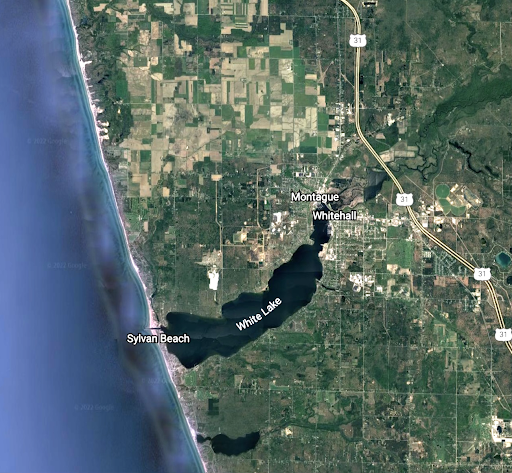
White Lake, Muskegon County, MI (Screenshot), Google Earth – Imagery 2022
Six Municipalities of the White Lake Area
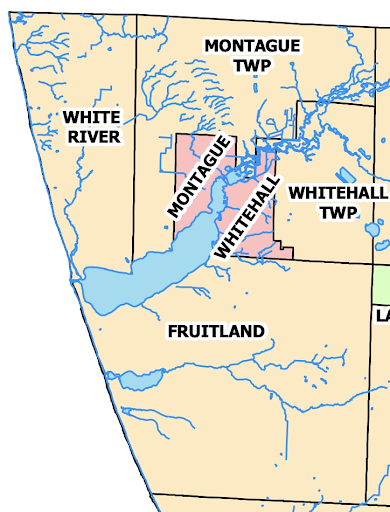
Cities, Townships and Villages of Muskegon County, MI (Screenshot), Muskegon County Equalization Mapping and GIS,
Map created: April 2006
Five Census Tracts that include the White Lake Area: 35, 37, 38, 39, 40
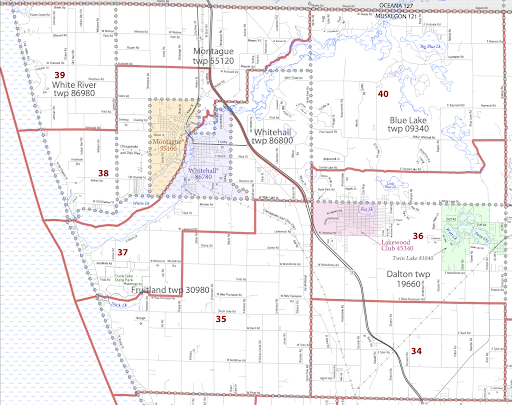
2010 Census Tract Reference Map (Screenshot): Muskegon County, MI: U.S. Census Bureau
The area surveyed for this project is bounded by Lake Michigan to the west, the Muskegon County border to the north, the eastern border of Montague, Whitehall and Fruitland townships to the east, and Duck Lake Road (the north-to-south midpoint of Fruitland Township) to the south.
Area Surveyed for this Project, showing Municipalities and Census Tracts
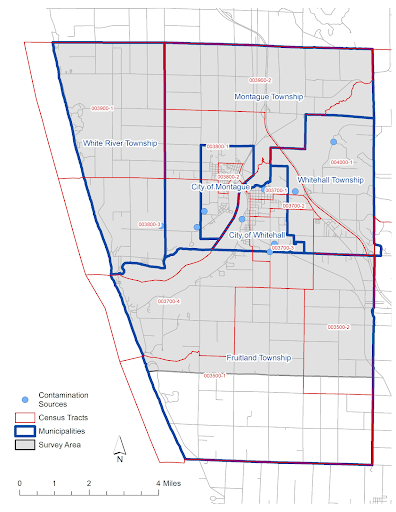
Map by Rick Sadler, Associate Professor, Division of Public Health, Michigan State University
The six municipalities outlined in blue are listed below, followed by their Year 2000 population/square miles.
White River Township — 1,338/15.9
Montague Township — 1,637/18.9
City of Montague — 2,407/2.7
City of Whitehall — 2,884/3.0
Whitehall Township — 1,648/9.4
Fruitland Township — 5,235/36.5 *
*Population/square miles for the entire township. Only participants living in the northern half of Fruitland Township were included.
The five census tracts (35, 37, 38, 39 and 40) are outlined in red. The map also shows the subdivisions of tracts 37 (003700-1, -2, -3 and -4), 38 (003800-1, -2 and -3) and 39 (003900-1 and -2).
The Contamination Sources blue dots on this map, located in census tracts 37, 38 and 40, are listed below (and years of operation or occurrence).
Tract 37 – Eagle Tanning Works/Whitehall Leather Company/Genesco (1865-2000), Misco/Howmet/Alcoa Howmet/Arconic (1951-present), Muskegon/Koch Chemical (1975-1991), Whitehall Municipal Well #3 (1980), White Lake Landfill and Shellcast (1981).
Tract 38 – Hooker Chemical/Occidental Chemical (1952-1982), E.I. duPont de Nemours/Chemours (1956-1996), Anderson Road Plume/Tech Cast (1978).
Tract 40 – Whitehall Wastewater Treatment Facility/Silver Creek site (1984).
For more information about the contamination sources listed above, see Groundwater Contaminants and Air Emissions.
The racial demographic of the population of the White Lake area in 2010 was approximately 94% white, and the average poverty level in 2010 for “All Families” (including families with and without children, 1- and 2-parent families, etc.) was 8.4%.