Cancer Incidence Statistics
The United States Cancer Statistics (USCS) are the official federal cancer statistics. USCS includes cancer registry data from the National Program of Cancer Registries (NPCR) and the Surveillance, Epidemiology, and End Results Program (SEER), and receives help from many partners that are crucial to the success of cancer registration and cancer surveillance in the United States.
In Michigan, the state registry is the Michigan Cancer Surveillance Program (MCSP), which participates in the NCPR program and is administered and reported by the Michigan Department of Health & Human Services (MDHHS). As patients are diagnosed with cancer, professional tumor registrars at the local level assign codes for the cancer types according to the universally-used coding system of the International Classification of Diseases for Oncology (ICD-O-3) and send the data to the state program.
Michigan citizens may find annual cancer incidence statistics by starting at the MDHHS Cancer Incidence and Mortality Tables page and following links provided. Citizens are also invited to contact the state registrar for data on cancer types that are not named on the MDHHS website or if they suspect that their community is part of a cancer cluster.
White Lake Area Cancers for ZIP Codes 49437 and 49461
During the years from 2009 to 2013, when our Health Committee was planning and conducting our survey, Dr. Jean Chang, epidemiologist at Public Health – Muskegon County, met with us periodically to provide us with information on local cancer incidence and to suggest next steps. Information that I had found online seemed to report only on cancer incidence at the county level, so we needed help to find information for the White Lake area.
In two cancer incidence reports shared with us in 2010, for Montague ZIP code 49437 and Whitehall ZIP code 49461, the totals of the combined incidence rates from 1999-2006 indicated that Montague and Whitehall rates per 100,000 population were greater than county rates, and county rates were greater than state rates: Montague – 576.5, Whitehall – 574.2, Muskegon County – 549.7, Michigan – 510.5. Yet these rates did not rise to a level of concern.
In a table comparing Montague, Whitehall, and other Muskegon County ZIP codes during the time period between 1995 and 2009, rates for the Montague area ZIP code ranged between a high of 819.3 in 1995 and a low of 438.7 in 2008, while for the Whitehall area ZIP code the rates ranged between a high of 730.6 in 1995 and a low of 297.8 in 2009.
In a graph presented by Public Health – Muskegon County comparing the White Lake area, 49444 and Muskegon County Incidence Trends, invasive cancer incidence rates (per 100,000 population) from 1995-2009 were showing a decline in the White Lake area (the average of the rates for ZIP codes 49437 and 49461), beginning with a rate per 100,000 of 774 in 1995, and ending with a rate of 409 in 2009. These compared with a fairly steady trend of rates for Muskegon County, which began with a rate of 507 in 1995 and ended with a rate of 499 in 2009, and contrasted with a rate for another ZIP code in southern Muskegon County (49444) that had shown markedly higher rates during this time period.
Reporting by Census Tracts rather than ZIP Codes
Over time I became concerned that data on cancer counts in the White Lake area might have become diluted because of the use of ZIP codes for cancer incidence reporting. Richard Casey Sadler (2016) explains why ZIP codes are poorly suited to analyze health data. ZIP codes were designed for mail delivery. Their boundaries do not line up with boundaries of cities, townships or counties, and one ZIP code may include a heterogeneous mix of city, rural, woodland, and agricultural areas. Attempts to determine the effect of a source of pollution on the health of its neighbors can be diluted by the expanse of the geographic area chosen.
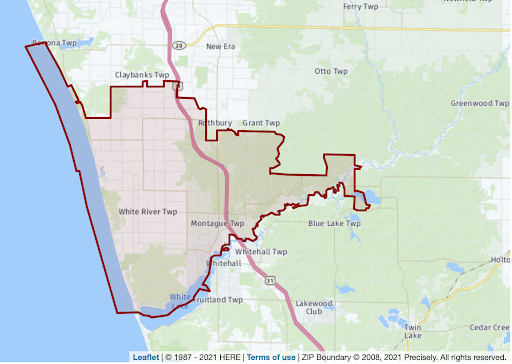
The 49437 ZIP code extends beyond the Muskegon County border into Oceana County. The industries that operated in the mid-20th century were located at the southern edge, near White Lake. People living at the far north and east edges of this ZIP code would have been unlikely to be exposed to contaminants from these industries, unless they worked at or near them or possibly attended school near them. People in the outlying areas may have had their own concerns: some participants living near farms had mentioned possible exposure to pesticides.

49437 ZIP Code Boundary Map Michigan HomeTown Locator
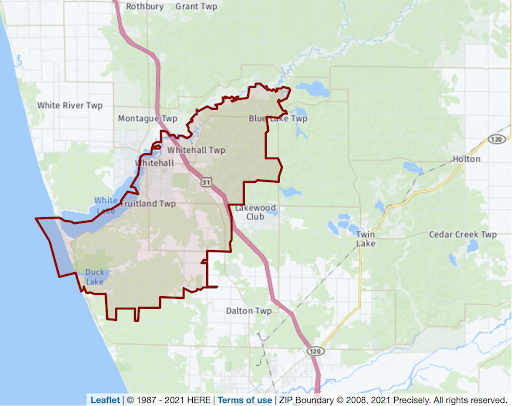
The 49461 ZIP code is similarly spread out, with its borders to the east and south being far from the population centers and from industries that had operated near White Lake.

49461 ZIP Code Boundary Map, Michigan HomeTown Locator
White Lake Area Cancers by Census Tract
I wanted to know if cancer incidence reporting by census tracts would be more accurate in revealing the cancer burden of our small community. Census tracts are small, relatively permanent statistical subdivisions of a county, whose boundaries generally follow visible and identifiable features, such as roads. The primary purpose of census tracts is to provide a stable set of geographic units for the presentation of statistical data.
According to a 2013 Centers for Disease Control (CDC) report that includes information on the use of census tracts and block groups in cancer clusters investigations:
“The census tract is defined by the U.S. Census Bureau, and it is a relatively homogeneous unit with respect to population characteristics. A census tract generally contains between 1,000 and 8,000 persons, with an optimum size of 4,000 persons…. Cancer clusters of concern frequently are confined to areas smaller than a census tract. Because census tracts are subdivided into census blocks and block groups, blocks and block groups might be combined if a census tract does not give the needed geographic boundaries. The number of cases occurring within a block or a block group might be far too small to allow reporting of cancer cases without privacy concerns or creating statistically unstable rates. Registries often will not release data at the block group level or even the census tract level because of privacy concerns” [Appendix A, Sept. 2013 Morbitity and Mortality Weekly Report].
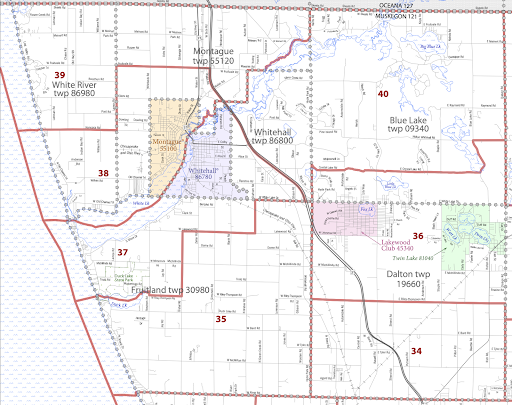
In 2021 I contacted Georgia Spivak, Cancer Statistician for the Michigan Department of Health & Human Services (MDHHS), and requested information on White Lake area cancer incidence by census tracts. We selected three census tracts whose borders are entirely within the borders of the six municipalities of the White Lake area: tracts 37, 38 and 39. We did not request data from MDHHS for tracts 35 and 40, because only small portions of census tract 35 (the portion north of Duck Lake Rd) and 40 (the portions within Montague and Whitehall Townships) are within the boundaries of the municipalities of our survey area.

Screenshot from the 2010 Census Tract Reference Map: Muskegon County, MI: U.S. Census Bureau. The census tracts are outlined in red, while the municipalities are defined by gray dotted borders.
Ms. Spivak kindly prepared two tables for us, listing the number of cancers diagnosed from 1985-2018 and reported to the Michigan Resident Cancer Incidence File for census tract 37, and for census tracts 38 and 39 combined. Due to smaller populations in census tracts 38 and 39 and concerns about confidentiality and reliability, MDHHS could not share with us the rates of cancer for either of these two tracts alone and needed to combine them for presentation to the public.
Michigan Resident Cancer Incidence File Tables 1 & 2 compare the census tracts 37 and 38-39 invasive cancer incidence rates with 1) incidence rates for Michigan residents, and 2) incidence rates for Muskegon County residents.
Comparison of Census Tract 38 and 39 Populations
Census tract 37 includes the City of Whitehall and the northern portion of Fruitland Township, where many homes are located along the White Lake shoreline. Tract 38 includes the City of Montague and the more densely populated portions of Montague Township and White River Township. Tracts 37 and 38 were also the locations of the industries from White Lake’s Environmental History that had operated in the mid-20th century. A large portion of Tract 39 is agricultural.
If public health officials had been able to reliably analyze cancer rates for census tract 38 independently, instead of combining it with tract 39, would they have found higher rates in tract 38 than when looking at the two census tracts combined? Would these rates have risen to a level of concern?
I was curious to know what percentage of our participants had lived in tract 38 at diagnosis, compared with tract 39. First, of the total average population of tracts 38-39 for 1980-2010, what percentage of the population resided in Tract 38?
The table below shows the populations of census tracts 37, 38, and 39 for each census year from 1980-2010.
Populations of Tract 37 and Tract 38-39, and Comparison of Tracts 38 and 39
| Decades | Population, Tract 37 | Population, Tracts 38-39 | Population, Tract 38 | Track 38 Percentage of Total Population of Tracks 38-39 | Population, Tract 39 | Track 39 Percentage of Total Population of Tracks 38-39 |
| 1980 | 5,074 | 4,886 | 3,372 | 69% | 1,514 | 31% |
| 1990 | 5,401 | 4,955 | 3,283 | 66% | 1,672 | 34% |
| 2000 | 5,683 | 5,381 | 3,477 | 65% | 1,904 | 35% |
| 2010 | 5,379 | 5,333 | 3,227 | 61% | 2,106 | 39% |
| Averages | 5,384 | 5,139 | 3,340 | 65% | 1,799 | 35% |
Social Explorer: Source for census tract populations by decade.
The average population of Tract 38 was 3,340 (65% of the population of tracts 38-39 combined), while the average population of Tract 39 was 1,799 (35% of the combined population).
Would we expect similar percentages for our participants’ cancers in Tract 38 compared to Tract 39? (This would not consider age and sex characteristics of each population.)
| Year of Diagnosis | MRCI Case Counts Census Tract 37 |
CMP Cancers Census Tract 37 |
MRCI Case Counts Census Tract 38-39 |
CMP Cancers Census Tract 38-39 |
CMP Cancers Census Tract 38 |
CMP Cancers Census Tract 39 |
| 1985 | 27 | 9 | 15 | 12 | 7 | 5 |
| 1986 | 28 | 8 | 26 | 4 | 4 | 0 |
| 1987 | 25 | 3 | 13 | 7 | 6 | 1 |
| 1988 | 24 | 6 | 17 | 3 | 3 | 0 |
| 1989 | 35 | 6 | 15 | 9 | 6 | 3 |
| 1990 | 32 | 7 | 10 | 5 | 5 | 0 |
| 1991 | 39 | 12 | 32 | 10 | 6 | 4 |
| 1992 | 26 | 7 | 26 | 10 | 10 | 0 |
| 1993 | 27 | 10 | 25 | 15 | 13 | 2 |
| 1994 | 23 | 15 | 33 | 14 | 8 | 6 |
| 1995 | 38 | 11 | 37 | 17 | 15 | 2 |
| 1996 | 35 | 12 | 33 | 14 | 11 | 3 |
| 1997 | 34 | 5 | 28 | 11 | 7 | 4 |
| 1998 | 25 | 14 | 31 | 18 | 13 | 5 |
| 1999 | 29 | 6 | 38 | 19 | 14 | 5 |
| 2000 | 36 | 11 | 37 | 15 | 10 | 5 |
| 2001 | 38 | 17 | 33 | 10 | 5 | 5 |
| 2002 | 36 | 14 | 38 | 12 | 9 | 3 |
| 2003 | 32 | 13 | 37 | 13 | 8 | 5 |
| 2004 | 43 | 12 | 25 | 11 | 8 | 3 |
| 2005 | 39 | 10 | 36 | 18 | 13 | 5 |
| 2006 | 36 | 14 | 29 | 8 | 5 | 3 |
| 2007 | 24 | 8 | 31 | 16 | 11 | 5 |
| 2008 | 37 | 13 | 26 | 14 | 11 | 3 |
| 2009 | 24 | 9 | 36 | 20 | 15 | 5 |
| 2010 | 38 | 8 | 35 | 20 | 12 | 8 |
| 2011 | 36 | 8 | 44 | 11 | 6 | 5 |
| 2012 | 41 | 1 | 39 | 7 | 4 | 3 |
| 2013 | 35 | 0 | 34 | 3 | 1 | 2 |
| Total | 942 | 269 (29% of 942) |
859 | 346 (40% of 859) |
246 (71% of 346) |
100 (29% of 346) |
The total number of cancers reported to MRCI for tracts 37 and 38-39 from 1985-2013 was 1,801. The total number of cancers of our participants that were diagnosed while full-time residents of tracts 37 and 38-39 from 1985-2013 was 615, or 34% of the official registry totals. (We do not know how many of the 615 cancers reported by our participants were among the 1,801 cancers reported to the MRCI file.)
For census tract 37 (Whitehall area), MRCI had recorded 942 cancers between 1985 and 2013. CMP participants had recorded 269 cancer diagnoses in tract 37 during the same years, only 29% of the official numbers. (I wondered if the comparatively low percentage of Whitehall area participants could be attributed to inadvertent bias, as more volunteers conducting surveys had been living in the Montague area during the survey period.)
For the combined tracts 38-39, MRCI had recorded 859 cancers, while CMP had recorded 346 cancers for the same period, or 40% of the official numbers for tracts 38-39.
Of the 346 CMP cancers reported for tracts 38-39, 246 (71%) were reported to be living in tract 38 at diagnosis, while 100 (29%) were reported to be living in tract 39.
The average population (1980-2010) of census tract 38 was 65% of the average population of tracts 38-39 combined. The total number of reported participants’ cancers (1985-2013) for tract 38 was 71% of the total reported cancers for tracts 38-39 combined.
Due to the nature of a voluntary, self-reporting survey, this comparison cannot provide evidence that the cancer burden in tract 38 was heavier than would have been expected for its population. Many variables apply, including the fact that the number of cancers we report for each tract are dependent upon the number of people that chose to participate in this project.
This comparison of tract 38 and 39 illustrates that there are barriers to recognizing when cancer rates are high when statistical units such as census tracts are used to try to discover the cancer burden of small communities in which some members of their population are located near a source of industrial pollution. A more direct approach may be needed, such as case-control studies of the people living in the immediate vicinity of the pollution source.

