Residential Mobility
I wondered about the impact of residential mobility on our understanding of environmental etiologies of cancers. The rates of cancer in the White Lake area (tied only to the address at the date of diagnosis) did not appear to draw alarm from government health officials, yet some of our participants commented on their personal encounters with health providers, within and outside of Muskegon County, that had expressed concerns about cancers in the White Lake area. These following accounts were relayed to our volunteers during initial discussions or followup conversations from surveys:
When a son turned 40 he wanted to have himself screened for prostate issues because of his dad’s history. He selected a specialist in Grand Rapids, Michigan, an hour away from his home. The doctor repeatedly questioned whether it was necessary for the son to be seeing him, just based on his dad’s history. Finally the son told him he had grown up in Montague. The doctor said, “Oh, you mean the White Lake area? That’s enough of a reason right there. You need to be here.”
A daughter said that when her dad was in the cancer unit at Hackley Hospital in 1992, there was a large map with flags indicating where all of the cancer patients lived. It was a sea of red in the White Lake area.
Could cancers attributed to the White Lake area in local statistics have been underrepresented? Had a large number of people that had grown up in the area during the period of industrial pollution moved away before they were diagnosed with cancer? Are cancers that are reported in incidence tables in any community truly representative of the cancer burden of that community? How might electronic medical records containing previous residence information be used in the effort to close the gap in knowledge about environmental hazards and disease?
Participants completing their survey for our cancer mapping project from 2009 to 2013 worked diligently to recall all of their previous White Lake area addresses and workplaces and the year they moved from one residence or workplace to another. Many were concerned about cancers in their own neighborhoods and hoped that this project would serve as an investigation of their concerns. I had shared this hope.
Below are some of the challenges and barriers I encountered while attempting to understand the data related to participants’ address locations.
- We had included people born 1910 or later in this project, and their cancers were diagnosed from 1943 to 2013, a span of 70 years.
- Many of our 1,015 participants had multiple cancer diagnoses, totaling 1,115 primary cancers: 923 people had one type of cancer, 85 had two cancers, six had three cancers, and one had four cancers.
- Of the participants with two or more primary cancers, some were living in different locations (within and outside of the White Lake area) for each cancer diagnosis, and in most cases their subsequent cancers were diagnosed years or decades after their first cancer.
- Participants had lived at up to nine White Lake area addresses, for periods of time that ranged from one year to 89 years. They had also moved into and out of the area. Some participants had been part-time or seasonal residents during some or all of their years in the area. We had also included people who had lived in the White Lake area but had moved away from the area prior to diagnosis.
- Many participants had worked at multiple workplaces.
The Latency Challenge
Latency has been defined as the amount of time that elapses between the onset of disease and its diagnosis. It has been estimated that latency periods for different types of cancer can range from a few years to several decades. Research on estimating the length of time between exposure and diagnosis with any particular type of cancer is still in its infancy. Considerations include 1) the time lapse between exposure and disease initiation and then between initiation and diagnosis, 2) the intensity or duration of a single exposure, 3) whether there are repeated exposures over time, 4) a person’s age at exposure, 5) genetics, and 6) diet and health behaviors.
Abecasis et al. (2020) mention additional considerations that can alter the length of time between exposure and diagnosis: that the cancer being considered may have developed anyway but the exposure accelerated cancer development, or that some cancers are discovered incidentally during a medical procedure for an unrelated condition (before the person would have experienced symptoms leading to diagnosis).
Some scientists have begun to study the previously unobservable events that occur at the cellular level, including specific mutations that lead to cancers and rates of replication of those mutated cells. As more data become available, researchers will be able to construct models to estimate cancer latency, such as the compartmental model proposed by Jacquez et al. (2015) that uses information from tumor histology and tumor genetics to estimate lengths of time in phases that occur between the mutation of a cell that initiates the process of disease progression toward the diagnosis of cancer and ultimately metastasis to other organs.
Catastrophic events sometimes help to estimate disease latency. Jacquez et al. (2015) mentions the Chernobyl nuclear accident of 1986 as one example of a cohort exposure, in which a common exposure occurs for a group of individuals and appears to result in an overall increase in disease risk. The Chernobyl disaster led to an increase in pediatric thyroid cancers following a latent period of four to six years (Nikiforov and Gnepp 1994). This would be a relatively short latency when compared with public perceptions that cancer takes many years, or sometimes decades, to develop.
I searched for a way to try to look at our participants’ many addresses based on the concept of latency.
Address at Cancer Diagnosis, or Onset?
It is obvious that cancer incidence statistics need to be associated with an address so we can have an approximation of how many people in a given community are being diagnosed with cancer. For the time being, it makes the most sense to use the address at diagnosis, while recognizing that an unknown percentage of the people may have been exposed to environmental pollution while living at a prior residence.
As we recorded participants’ White Lake area addresses for this cancer mapping project, I began to realize that we had a dilemma. Participants had lived at two, three, four, five or more White Lake area addresses. What point would there be in trying to map all of those addresses? How would we select one address to map other than the address at diagnosis? We couldn’t simply choose their first address because some people had lived at their first address for only a year or two before moving to a more permanent residence. We couldn’t choose the address at which they had lived the most years: some people may have lived at their longest residence only two or three years, while others may have lived at an address for up to 89 years prior to their diagnosis. Still others lived at a number of addresses for equal periods of time.
I wanted to try to select one address in a purposeful way. I wanted to be able to take a guess at where participants might have been living at the time of their onset of cancer.
In this section I propose a way to hypothetically determine participants’ address at onset by working backwards using the length of latency for certain cancers – to come up with an estimated “Year of Onset” according to participants’ type of cancer, and then determine what their address was during that year. Research on the initiation and progression of a cancer cell is emerging and is not yet available for most cancers, so I looked for any information that might help to estimate the length of latency periods for our participants’ cancers. I found clues in research done for the World Trade Center Health Program. Its mission was to determine minimum latencies for types of cancer that could have been caused by hazards related to the 9/11 attacks on the World Trade Center, so that exposed people who later developed cancer could be considered for compensation. The WTC researchers describe the methods and resources that they ultimately used [p. 3-4] to determine minimum latencies.
In the introduction of the Executive Summary of the WTC Health Program report [p. 2] the administrator cites Nadler and Zurbenko (2014) for their report, Estimating Cancer Latency Times Using a Weibull Model, as an example to illustrate the wide range of possible latency periods (2.2 to 57 years) between onset and diagnosis.
Nadler and Zurbenko’s Methods for Estimating Latencies
Nadler and Zurbenko based their latency estimates on survival times after cancer diagnosis (years between diagnosis and death). Although these estimates do not use emerging technologies that look at events at the cellular level (mutations and rates of replication of mutated cells), Nadler and Zurbenko’s work provides a useful tool for me to use to propose a hypothetical comparison of our participants’ address at onset and address at diagnosis.
Their table, Approximate latency times from cancer initiation to diagnosis by cancer site, lists 44 cancer types and their estimated years from onset to diagnosis for each type [p. 6]. Because they were relying on information derived through observation of cancer progression after diagnosis, Nadler and Zurbenko limited their cohort using the following guidelines [p. 4] to select the 44 cancer types that would be applicable for estimating years from onset to diagnosis from observable cancer survival information. They:
- included only patients aged 18 or older,
- included only those with invasive malignant neoplasms (excluding in-situ cancers), and
- restricted their choices to those with high mortality rates and limited availability of treatment options so that the length of survival time after diagnosis would provide a basis from which to calculate more precise estimated times between cancer onset and cancer diagnosis.
Matching our Participants’ Cancer Types to Nadler & Zurbenko’s Model
Following Nadler and Zurbenko’s guidelines, I searched through our list of 1,015 participants and selected only those aged 18 or older at diagnosis and those presumed to have had invasive malignant cancers (thus excluding in-situ cancers) that closely matched the 44 cancer types they had chosen. Ultimately I was able to include 25 common and rare cancer types on our participants’ list, from which I could plausibly use the authors’ approximate years from onset to diagnosis to estimate a year of onset for participants with these 25 cancer types.
I excluded individual cancers that may not have matched the groups selected by the authors. For example, I excluded benign brain tumors and spinal cord tumors, including only malignant brain tumors. I also excluded cancer types named by participants or from death certificates that lacked enough specificity to know whether they were the same type as listed by Nadler and Zurbenko, such as “head and neck” or “leukemia” not otherwise specified (NOS). I did include specific head and neck cancers that were on Nadler and Zurbenko’s list and were named by our participants (larynx, tongue, mouth, tonsil, sinus & nasal cavity, throat, and oropharynx), as well as specific leukemia types named by our participants (acute lymphocytic, acute myeloid, chronic lymphocytic, and chronic myeloid).
Nadler and Zurbenko had listed ascending colon, descending colon, transverse colon, and sigmoid colon cancers separately. I did not have this precise information for any of our participants’ colon cancers, so I used the authors’ designation, “Large intestine, NOS” (not otherwise specified) for our participants’ colon cancers. I listed our participants’ non-Hodgkin lymphomas under Nadler and Zurbenko’s “NHL-nodal” type, after researching “nodal” and “extranodal” lymphomas and concluding that those on our list were most likely of the nodal type. (Extranodal lymphomas apparently are listed by the site first, for example, “stomach lymphoma.”) Hodgkin Lymphomas were not on the authors’ list, so I excluded them from this list.
Of the 1,015 participants of the White Lake area cancer mapping project, 530 had been diagnosed with their cancer as adults while they were full-time residents in the White Lake area and had been diagnosed with 536 cancers that could be matched as accurately as possible with 25 of the 44 cancers for which the number of years between onset and diagnosis had been estimated by Nadler and Zurbenko.
| Nadler & Zurbenko Cancer Type | N & Z Years from Onset to Diagnosis (rounded) | 33% Margin of Error, rounded | Number of cancers diagnosed |
|
Shorter Latencies (0-14 years) |
|||
| Chronic lymphocytic leukemia | 2.2 (2) | ± 1 | 5 |
| Chronic myeloid leukemia | 5.1 (5) | ± 2 | 3 |
| Esophagus | 9.4 (9) | ± 3 | 15 |
| Liver | 10.8 (11) | ± 4 | 7 |
| Lung and bronchus | 13.6 (14) | ± 5 | 140 |
| Myeloma | 3.6 (4) | ± 1 | 20 |
| Pancreas | 8.4 (8) | ± 3 | 23 |
|
211 Adults diagnosed with 213 cancers as full-time residents |
|||
|
Medium Latencies (15-29 years) |
|||
| Acute myeloid leukemia | 25.7 (26) | ± 9 | 3 |
| Brain | 21.9 (22) | ± 7 | 19 |
| Breast | 16.3 (16) | ± 5 | 133 |
| Floor of Mouth | 21.9 (22) | ± 7 | 2 |
| Gallbladder | 25.2 (25) | ± 8 | 1 |
| NHL-nodal (non-Hodgkin lymphoma) | 26.5 (27) | ± 9 | 30 |
| Nose, nasal cavity, and middle ear | 23.0 (23) | ± 8 | 3 |
| Other oral cavity and pharynx | 16.9 (17) | ± 6 | 8 |
| Small intestine | 26.0 (26) | ± 9 | 1 |
| Stomach | 22.3 (22) | ± 7 | 8 |
| Tongue | 26.7 (27) | ± 9 | 3 |
| Tonsil | 18.9 (19) | ± 6 | 1 |
|
208 Adults diagnosed with 212 cancers as full-time residents |
|||
|
Longer Latencies (30+ years) |
|||
| Acute lymphocytic leukemia | 35.7 (36) | ± 12 | 1 |
| Kidney and renal pelvis | 48.2 (48) | ± 16 | 17 |
| Large Intestine, NOS (colon) | 37.9 (38) | ± 13 | 67 |
| Larynx | 35.4 (35) | ± 12 | 5 |
| Ovary | 44.1 (44) | ± 15 | 13 |
| Rectum | 29.8 (30) | ± 10 | 8 |
|
111 Adults diagnosed with 111 cancers as full-time residents |
|||
Methods for Selecting Address at Onset
The “Years from onset to diagnosis” as estimated on Nadler and Zurbenko’s list and applied to the 25 cancer types on our cancer mapping project list range between 2.2 years (chronic lymphocytic leukemia) to 48 years (cancer of the kidney and renal pelvis). I rounded each to the nearest whole number, then subtracted that number from each of our participant’s Year of Diagnosis to find the estimated Year of Onset.
Assigning an Address at Onset to the Year of Onset proved to be a little more challenging.
Often, participants were found to be either out of the White Lake area during what would have been their Year of Onset, or their Year of Onset was the year they had moved out of one address and into the next, which made it difficult to decide which address to use. So, for participants with multiple addresses, I developed rules to provide consistency and avoid bias in selecting which address would be identified as each participant’s Address at Onset for each cancer diagnosis.
Year of Onset = The year the participant was diagnosed with this cancer, minus the Nadler and Zurbenko estimated number of Years from Onset to Diagnosis for that participant’s cancer type.
Range of Onset Years = the estimated Year of Onset, ± a 33% margin of error. For a latency of 15 years, the margin of error would be 5 years. If the Year of Onset was 1992, the Range of Onset Years would be 1987 to 1997. Their residence at an address between 1987 and 1997 could qualify this address to be considered as their Address at Onset.
Range of Residence Years = From the year the participant moved into an address to the year they moved out. If a participant lived at an address from 1996 to 1998, and their estimated Year of Onset was 1997, then 1997 was within their Range of Residence Years at that address. That address was selected, even if they had lived at their previous or next address for a longer period of time.
Below are rules that were applied in the case of ties for Address at Onset:
- If the estimated Year of Onset was within the Range of Residence Years at an address, this address was used even if the number of years at this address was fewer than the number of years within the Range of Onset Years at the previous or next address.
- If the Year of Onset was the year moved out of one address and into the next address, the address at which the participant had lived the most years within the Range of Onset Years was selected. If these were both the same, then the address at which the Range of Residence Years was greatest was selected.
- If the participant was living outside of the White Lake area during the Year of Onset but had lived at two White Lake area addresses that were within the Range of Onset Years, the address at which the person had lived during the years closest to the estimated Year of Onset was selected. If the person had lived at that address for one year or less, the address with the most years within the Range of Onset Years was used. If there was a tie (for example, there were an equal number of Range of Onset Years listed at each of two addresses), the address with the greatest Range of Residence Years was selected.
The need for the above rules highlights the complex nature of residential mobility and the task of trying to apply what we know (and don’t know) about latency to try to understand environmental causes of cancer.
Length of Latency and Confidence in Cancer Incidence Reporting
How well do cancer incidence tables represent the burden of cancer in a geographical area when we don’t know how long the people diagnosed with cancer had lived at their residence of record at the time of their diagnosis?
Having estimated the Address at Onset for the cancers of the participants in this cancer mapping project, I wanted to know what percentage of the participants were living at the same address at onset and diagnosis, as compared with the percentage of participants that were living at a different addresses at onset and diagnosis. I also was interested in knowing how many participants had been away at onset but were living full time in the area at diagnosis.
The pie charts below compare the percentages of the 530 participants (536 cancers) that were living at the same versus a different residence at estimated onset and diagnosis, for cancer types having estimated Short, Medium and Long latencies.
What Percentage of the 536 Cancers were Diagnosed while Participants were Living at the Same Full-Time Residence at Diagnosis as at Estimated Onset?
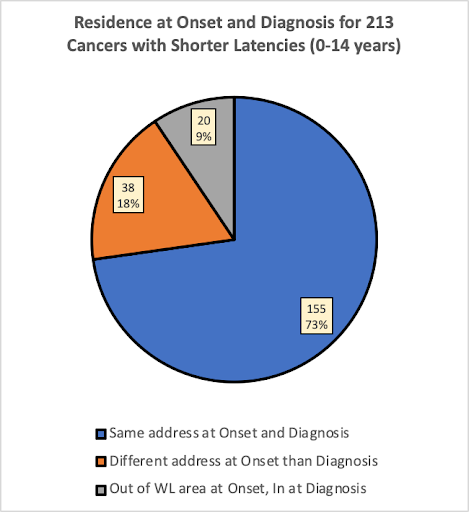
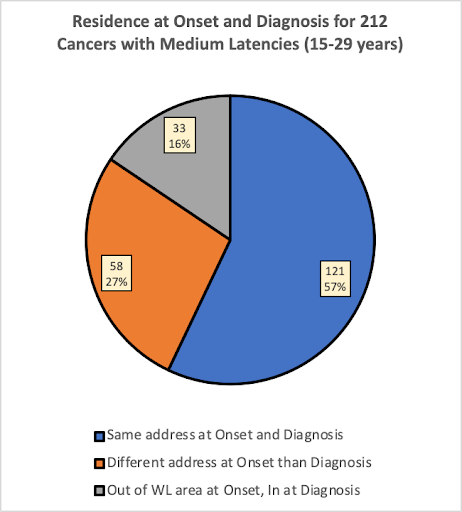

In the group of participants having cancers with shorter latencies (0-14 years), 73% of the cancers were diagnosed while the participant was living at the same address at estimated onset as at diagnosis. In the group with medium latencies (15-29 years), 57% of the cancers were diagnosed while the participant was living at the same address, and in the group with long latencies (30+ years), only 37% of the cancers were diagnosed while the participant was living at the same address at onset as at diagnosis.
As would be expected, the pie charts suggest that people having cancers with longer latencies would be less likely to have lived in the same place at estimated onset than people with cancers having shorter latencies. This is expected because the longer latency provided more time to move for any number of reasons.
Knowing more about the length of latency periods for specific types of cancer would help to determine how much confidence we should have in the extent to which a community’s cancer incidence tables (based on residence at the time of diagnosis) reflect the cancer burden of their community.
When and Where: Decade of Onset, and Onset Address by Census Tract
In the previous sections, I looked at all 536 cancers that could be matched approximately to the Nadler and Zurbenko list and that were diagnosed while participants were living in the White Lake area as full-time residents. I attempted to illustrate the problem of residential mobility and the uncertainty about to what extent cancer incidence statistics reflect the cancer burden of a community. I compared percentages of cancers having shorter, medium, and longer estimated latencies of participants that were living full time in the White Lake area at diagnosis, and had been living full time 1) at the same White Lake area address at onset, 2) at a different White Lake area at address at onset, and 3) at a residence outside of the White Lake area during what could have been their onset year.
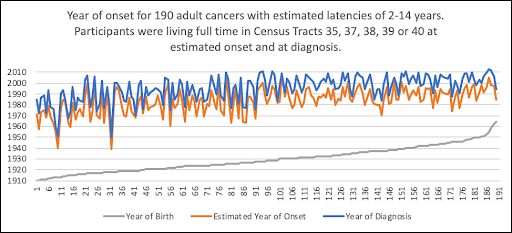
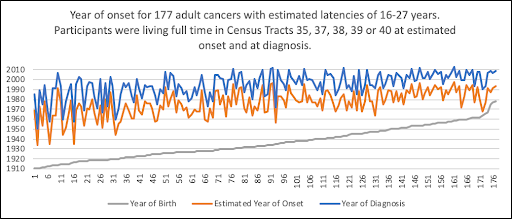
In this section I want to look more closely at participants’ estimated address at onset, to get a sense of when these participants’ estimated onset periods might have occurred in relation to their year of diagnosis, and also where they had lived (first by census tract, and then their location on a map) when their estimated onset might have occurred.
The cancer counts in the tables and graphs below include only the 442* cancers of participants who:
- had a cancer type on our list that could be approximately matched with the 44 cancer types for which Nadler and Zurbenko had estimated the number of years between onset and diagnosis. (Only participants diagnosed at age 18 and over could be included.)
- were living full time in the White Lake area (census tract 35, 37, 38, 39, or 40) during the year they were diagnosed with cancer, AND
- had lived full time in census tract 35, 37, 38, 39, or 40 during their estimated year of onset.
* After Years of Latency had been calculated, and a determination had been made about which address would be selected as the participant’s Address at Onset, and addresses had been assigned to census tracts, 442 cancers remained for this inquiry. Ninety-four cancers were excluded from the original 536 cancers because 1) the participants had been living outside of the White Lake area at estimated Onset, or 2) the participants had been part-time residents during their estimated Year of Onset, or 3) in six cases, the residence location had been described as an intersection that was a dividing line between two census tracts so that it was not possible to determine the census tract of residence.
The 2010 Census Tract Reference Map below shows the census tracts of the White Lake area (outlined in red), overlaying the municipalities (outlined in gray dotted lines). Census tracts 37, 38, and 39 are entirely within the boundaries of the area surveyed for this cancer mapping project. Only a small portion of census tracts 35 (the portion above Duck Lake Road) and 40 (the portion within Whitehall Township) are within the boundaries of the municipalities of the White Lake area, so numbers of participants from these tracts will be smaller.

Screenshot from the 2010 Census Tract Reference Map: Muskegon County, MI: U.S. Census Bureau
WHEN would the Estimated Year of Onset have Occurred?
Cancers with Short Latencies
WHERE (in which census tract) would the Participants have Lived at Estimated Onset?
Cancers with Short Latencies
| Nadler & Zurbenko Cancer Types having shorter estimated latencies (0-14 years) | N & Z estimated Years, Onset to Diagnosis | Census Tract 35 # of Cancers |
Census Tract 37 # of Cancers |
Census Tract 38 # of Cancers |
Census Tract 39 # of Cancers |
Census Tract 40 # of Cancers |
Totals for Tracts 35, 37, 38, 39, 40 |
| Chronic lymphocytic leukemia | 2.2 | 0 | 1 | 4 | 0 | 0 | 5 |
| Chronic myeloid leukemia | 5.1 | 0 | 2 | 1 | 0 | 0 | 3 |
| Esophagus | 9.4 | 0 | 7 | 8 | 0 | 0 | 15 |
| Liver | 10.8 | 1 | 2 | 3 | 1 | 0 | 7 |
| Lung and bronchus | 13.6 | 11 | 44 | 45 | 19 | 4 | 123 |
| Myeloma | 3.6 | 3 | 7 | 5 | 4 | 0 | 19 |
| Pancreas | 8.4 | 3 | 6 | 7 | 2 | 0 | 18 |
| Totals | 18 | 69 | 73 | 26 | 4 | 190 | |
WHEN would the Estimated Year of Onset have Occurred?
Cancers with Medium Latencies
WHERE (in which census tract) would the Participants have Lived at Estimated Onset?
Cancers with Medium Latencies
| Nadler & Zurbenko Cancer Types having medium estimated latencies (15-29 years) | N & Z estimated Years, Onset to Diagnosis | Census Tract 35, # of Cancers |
Census Tract 37, # of Cancers |
Census Tract 38, # of Cancers |
Census Tract 39, # of Cancers |
Census Tract 40, # of Cancers |
Totals for Tracts 35, 37, 38, 39, 40 |
| Acute myeloid leukemia | 25.7 | 0 | 3 | 0 | 0 | 0 | 3 |
| Brain | 21.9 | 0 | 4 | 6 | 0 | 2 | 12 |
| Breast | 16.3 | 8 | 42 | 54 | 15 | 1 | 120 |
| Floor of Mouth | 21.9 | 1 | 0 | 0 | 1 | 0 | 2 |
| Gallbladder | 25.2 | 0 | 1 | 0 | 0 | 0 | 1 |
| NHL-nodal (non-Hodgkin lymphoma) | 26.5 | 2 | 7 | 4 | 7 | 0 | 20 |
| Nose, nasal cavity, middle ear | 23.0 | 0 | 0 | 1 | 0 | 0 | 1 |
| Other oral cavity, pharynx | 16.9 | 1 | 2 | 4 | 0 | 0 | 7 |
| Small intestine | 26.0 | 1 | 0 | 0 | 0 | 0 | 1 |
| Stomach | 22.3 | 0 | 3 | 2 | 1 | 0 | 6 |
| Tongue | 26.7 | 1 | 0 | 2 | 0 | 0 | 3 |
| Tonsil | 18.9 | 0 | 0 | 1 | 0 | 0 | 1 |
| Totals | 14 | 62 | 74 | 24 | 3 | 177 | |
WHEN would the Estimated Year of Onset have Occurred?
Cancers with Long Latencies

Three of the points in the above chart appear to indicate an onset year prior to, or close to, the participant’s birth. The 33% margin of error applied to participant’s estimated Year of Onset for long latencies resulted in Range of Onset Years of ±10 to ±16 years. In each case above, the person was diagnosed at a young age. The upper range of possible years to be considered for these participants’ Year of Onset would have been up to 10-16 years later than shown on this graph.
WHERE (in which census tract) would the Participants have Lived at Estimated Onset?
Cancers with Long Latencies
| Nadler & Zurbenko Cancer Types having long estimated latencies (30+ years) | N & Z estimated Years, Onset to Diagnosis | Census Tract 35 # of Cancers |
Census Tract 37 # of Cancers |
Census Tract 38 # of Cancers |
Census Tract 39 # of Cancers |
Census Tract 40 # of Cancers |
Totals for Tracts 35, 37, 38, 39, 40 |
| Acute lymphocytic leukemia | 35.7 | 1 | 0 | 0 | 0 | 0 | 1 |
| Kidney and renal pelvis | 48.2 | 1 | 3 | 6 | 0 | 0 | 10 |
| Large Intestine, NOS (colon) | 37.9 | 3 | 15 | 22 | 6 | 2 | 48 |
| Larynx | 35.4 | 0 | 1 | 3 | 0 | 0 | 4 |
| Ovary | 44.1 | 0 | 1 | 1 | 2 | 1 | 5 |
| Rectum | 29.8 | 1 | 2 | 4 | 0 | 0 | 7 |
| Totals | 6 | 22 | 36 | 8 | 3 | 75 | |
Maps: Residence Locations at Estimated Onset and Diagnosis
First, a reminder that this comparison of addresses at estimated onset and diagnosis is a hypothetical exercise. Research into length of latency periods is in its infancy, and I have used the Nadler and Zurbenko estimated latencies merely as an experiment to imagine what could be done if we knew more about latency periods for types of cancer.
When we previously looked at pie charts, tables, and graphs comparing three groups of cancers – those with Short, Medium, and Long estimated latencies – the obvious assumption seemed to be borne out: people with cancers having longer latencies were more likely to live in different places at onset and diagnosis than people with medium or short latencies.
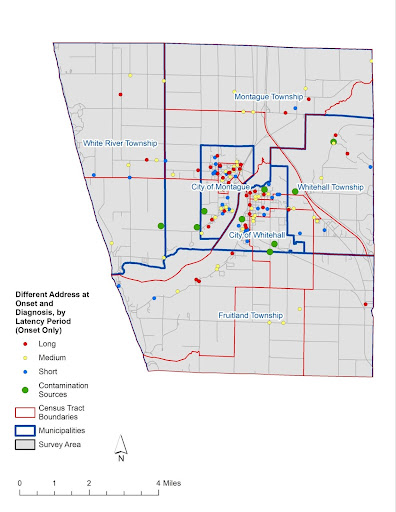
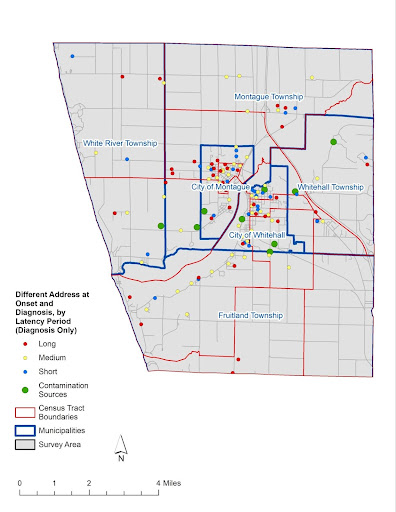
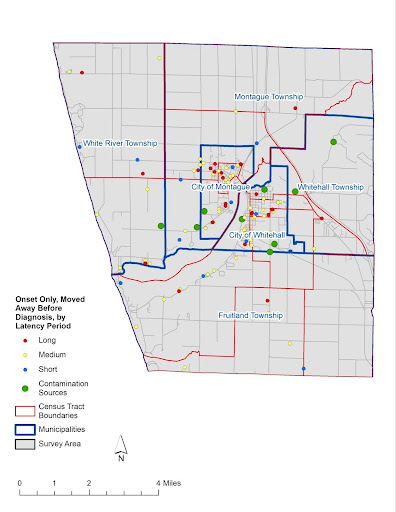
The following four maps show residence locations of participants that had one of the 25 cancer types that I was able to match with the Nadler & Zurbenko list of 44 cancer types for which they had estimated length of latency between onset and diagnosis. Of the original 536 cancers on our list that were included in the 25 cancer types, 448 of them had been living full time in the White Lake area during both their year of diagnosis and during their estimated onset period:
- 314 of these lived at the same address at estimated onset and diagnosis and are shown in Map 1.
- 134 of these lived at one address at estimated onset, shown in Map 2a, and a different address at diagnosis, shown in Map 2b.
For 103 cancer diagnoses that could be closely matched to the Nadler and Zurbenko list, the participant was living full time in the area during their estimated onset period, but had moved away before being diagnosed or were living part time in the area when diagnosed and their cancer likely would have been counted elsewhere. These are shown in Map 3.
For 88 cancer diagnoses that could be matched to the Nadler and Zurbenko list, the participant was in the area only at the time of diagnosis. We did not create a map for these 88 cancer diagnoses because my interest here is where people had lived when their potential onset of cancer may have occurred.
The four maps below use color-coded dots for the length of latency, according to the Nadler and Zurbenko list. Prior to each map is a count of participants who fall into each latency timespan category. Also marked on these maps in green dots are the major contamination sources explored in earlier sections of this report.
Map 1: Same Address at Onset and Diagnosis: 314 participants that were living at the Same address at Estimated Onset and Diagnosis. Each point represents their residence location at both onset and at diagnosis: 155 had Short Latencies, 122 had Medium Latencies, and 37 had Long Latencies.

Map by Rick Sadler, Associate Professor, Division of Public Health, Michigan State University
Map 2a: Different Address at Onset and Diagnosis – Address at Onset: 134 participants were living at a Different White Lake area address at Estimated Onset and Diagnosis. Each point represents their residence location at estimated Onset: 38 had Short Latencies, 58 had Medium Latencies, and 38 had Long Latencies.
Map by Rick Sadler, Associate Professor, Division of Public Health, Michigan State University
Map 2b: Different Address at Onset and Diagnosis – Address at Diagnosis: for the same 134 participants that were shown on Map 2a who were living at a Different White Lake area address at Estimated Onset and Diagnosis, each point represents their residence location at Diagnosis: 38 had Short Latencies, 58 had Medium Latencies, and 38 had Long Latencies.
Map by Rick Sadler, Associate Professor, Division of Public Health, Michigan State University
Map 3: Moved Away Before Diagnosis or Part Time at Diagnosis – Address at Onset: 103 participants whose cancers closely matched the 44 cancer types named by Nadler and Zurbenko were living at a White Lake area address at estimated Onset, but moved away prior to Diagnosis, or were living in the area part time at diagnosis. These participants would not have been counted in local cancer incidence statistics. Each point represents their residence location at estimated Onset: 16 had Short Latencies, 64 had Medium Latencies, and 23 had Long Latencies.
Map by Rick Sadler, Associate Professor, Division of Public Health, Michigan State University
The above maps are intended to again recognize that people exposed to carcinogens may be living elsewhere by the time they are diagnosed with cancer. More research is needed on length of latency periods for types of cancer, paired with data on residential histories, to trace likely onset estimates in order to gain a more complete picture of potential environmental impacts leading to cancer.

